Cleaned and standardized 8,000 records from the Nashville Housing Data table in SQL Server by formatting dates, splitting addresses, converting indicators, and removing duplicates. Data is available on
GitHub
.


Analyzed a database with three tables (sales, customer, product) using PostgreSQL to calculate metrics like AGV and total sales, and identify top customers, products, and regional trends with SQL techniques (GROUP BY, WITH, JOIN). Data is available on
GitHub
.

Analyzed 9,000 COVID-19 records from tables (covid_deaths and covid_vaccination) in SQL Server to uncover insights into infection rates, mortality, and vaccination progress. Techniques: Window functions, joins, and temporary tables for efficient data analysis. Data sourced from
Our World in Data
.

This holds all of my Tableau Dashboards.

In this project I look at what variables effect the gross revenue from movies. Data is available on
GitHub
.
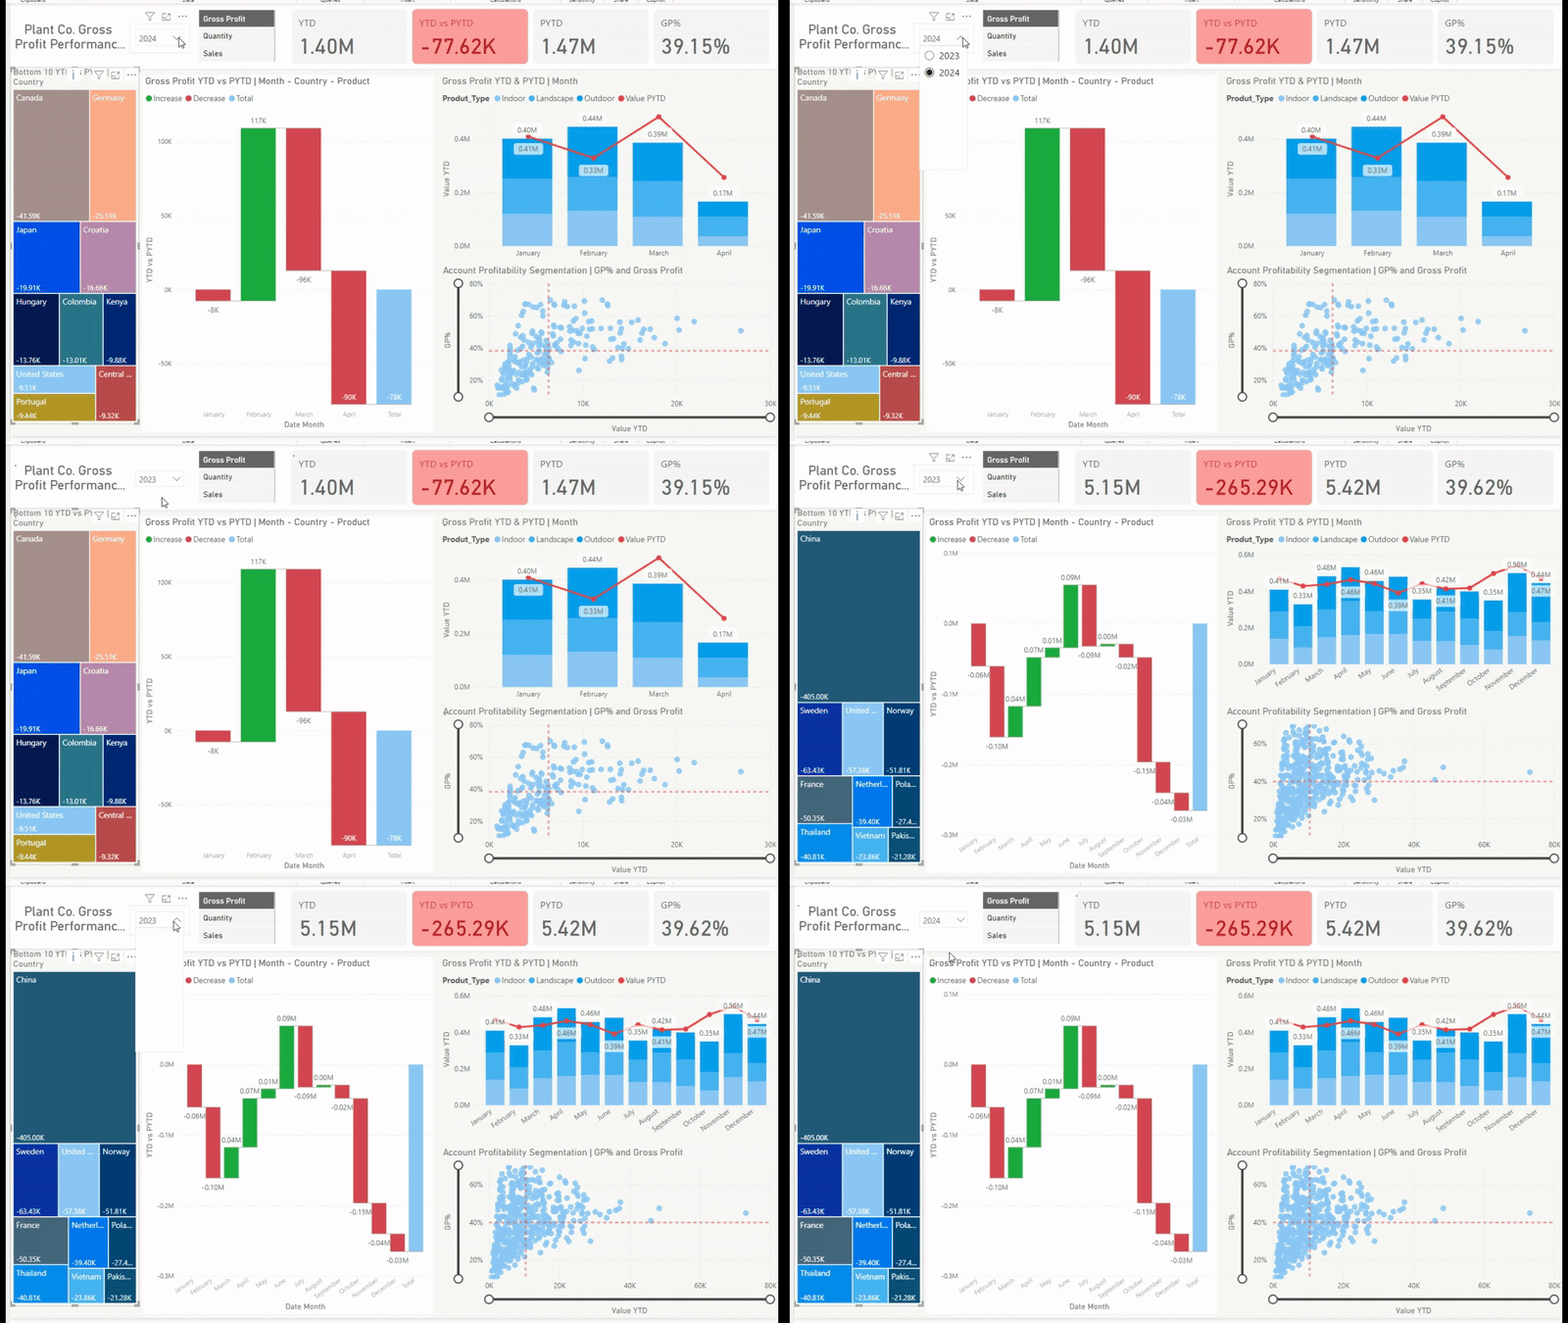
This holds alls my Power BI Projects .